Web Design & Development
Highland (USA)
March 23, 2024
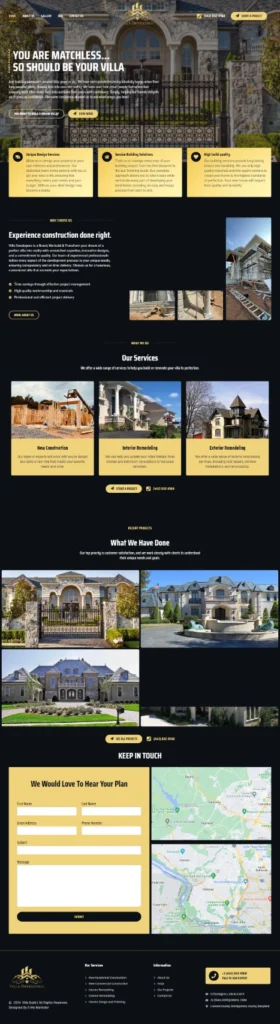
Villa Developers came to us with a very basic website design that needed fixing not only with launching but also with low-quality graphics and loading speed. We mutually decided to start from scratch and build a brand new website after thorough market and competitor research. Let’s take a look at the services that we provided them to create a high-ranking website:
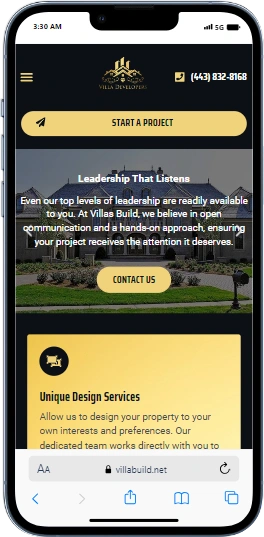
Our front-end and back-end developers have utilized the latest programs to create a website for Villa Build Developers that follows the latest industry trends. Developers used coding languages like HTML, CSS, and JavaScript. Site architecture was designed for easy navigation, and SEO best practices were integrated. We have incorporated a scalable UI/UX design that is customizable on a secure domain and mobile-friendly.
Our front-end and back-end developers have utilized the latest programs to create a website for Villa Build Developers that follows the latest industry trends. Developers used coding languages like HTML, CSS, and JavaScript. Site architecture was designed for easy navigation, and SEO best practices were integrated. We have incorporated a scalable UI/UX design that is customizable on a secure domain and mobile-friendly.
Our front-end and back-end developers have utilized the latest programs to create a website for Villa Build Developers that follows the latest industry trends. Developers used coding languages like HTML, CSS, and JavaScript. Site architecture was designed for easy navigation, and SEO best practices were integrated. We have incorporated a scalable UI/UX design that is customizable on a secure domain and mobile-friendly.
When our clients at Villa Developers were satisfied, we launched their website after A/B testing and minor revisions here and there. Now, take a look at how, with the magic touch of our team, they became a success story among their peers.
Click-Through Rate (CTR): 30% of users clicked on the promotional banner. Bounce Rate: 15% of visitors left after viewing just one page, reduced from 70% previously Average Session Duration: Users spent an average of 3 minutes on the site. Pages per Session: Visitors viewed an average of 5 pages per session. Social Shares and Likes: Blog posts, on average, received 200-250 likes and 50 shares. Conversion Rate: 4% of email recipients completed a purchase. Return Visits: 30% of visitors returned to the site within a month.
Annual Revenue Growth: Forecasting of 10-15% year-over-year increase. Project Completion Rate: 90-95% of projects completed on time and within budget. Customer Satisfaction Rate: 85-90% of clients rate their experience as “satisfied” or “very satisfied.” Lead-to-Client Conversion Rate: 20-30% of leads convert into paying clients. Gross Profit Margin: 25-30% of revenue retained as gross profit. Repeat Business Rate: 30-40% of clients return for additional services.
Net Promoter Score (NPS): 40-60, indicating strong customer loyalty and satisfaction. Customer Satisfaction Score (CSAT): 85-90% of users rate their experience as satisfactory or higher. Customer Effort Score (CES): 4-5 on a scale of 1-7, indicating users find interactions easy and straightforward. Feedback Response Rate: 20-30% of users provide feedback after an interaction. Resolution Time: 24-48 hours to resolve user issues or inquiries. Positive vs. Negative Feedback Ratio: 4:1, with four positive comments for every negative one.
We measure the success of any of our projects in numbers and percentages only. Tangible outcomes not only give you a clear picture of your brand’s progress but also help you record and compare your growth periodically.
We measure your success against your competitors with metrics like Market Shares, Competitive Pricing Range, Brand Recognition, Customer Reviews, Social Media Engagement, and Advertising Spend. We evaluate these indicators on a regular basis to ensure that you stay at the top of your niche.
A biannual or quarterly website analysis is done to make sure that your webpage is the best that it can be. Our key indicators in this evaluation include Average Load Time, Mobile Responsiveness, Organic Search Traffic, Conversion Rate, Bounce Rate, and Average Session Duration.
We go one step further to continuously optimize your website on search engines by keeping an eye on metrics like Keyword Rankings, Backlink Quality, Page Authority, Domain Authority, Organic Click-Through Rate, and On-Page SEO Score.
We always prefer interactive portfolios, which engage potential customers, instead of a static album. An interactive portfolio makes exploring your work fun and easy for clients. It shows off your projects more engagingly, letting your skills shine.
© 2025 B My Marketer. All rights reserved.